
Sea-Intel research shows that 41% of global container movements are now empty repositioning legs, up from 31% in 2019.
This increase highlights an inefficiency that extends across the global supply chain, impacting carriers, ports, freight forwarders, and BCOs alike.
This imbalance represents a structural cost to the industry. Empty moves incur storage and handling charges and impact the availability of containers for revenue-generating cargo. The consequences are felt across the supply chain: carriers absorb higher operating expenses, while freight forwarders and BCOs often face reduced reliability and tighter equipment supply.
Why empty moves can’t be eliminated: the container market is inherently imbalanced
The drivers of empty repositioning are deeply embedded in global trade flows:
- Structural imbalance: Few ports achieve balance between imports and exports, meaning some degree of empty repositioning will always be required.
- Commodity and equipment mix: Consumer-driven import markets often require 40’ dry containers, while exports lean toward 20’ dry or reefers, creating a persistent mismatch.
- Seasonality: Agricultural harvests, retail demand peaks, and manufacturing cycles all create shifting imbalances that impact container flows.
For these reasons, eliminating empty repositioning isn’t feasible. But it can be better managed, and carriers that optimize cargo selection gain measurable financial and competitive advantage.
Understanding these structural imbalances is the first step toward managing them more effectively through data and technology.
Financial impact on carriers
Equipment cost is one of the most significant variable costs on a carrier’s trade lane P&L. Some elements of this cost are largely fixed or sunk—such as lease or depreciation—while others, like depot storage and repair and maintenance, vary with operations.
The most variable element, however, is repositioning expense. Depending on port inventory, this can either be a debit (a cost burden) or a credit, an offsetting benefit when empties are efficiently redeployed.
Carriers that efficiently manage their cargo mix, optimizing port pairs to maximize match-back and thereby minimise movements of full units between deficit and surplus ports, can lower repositioning costs and improve trade-lane profitability.
Lessons from FMC and U.S. port data
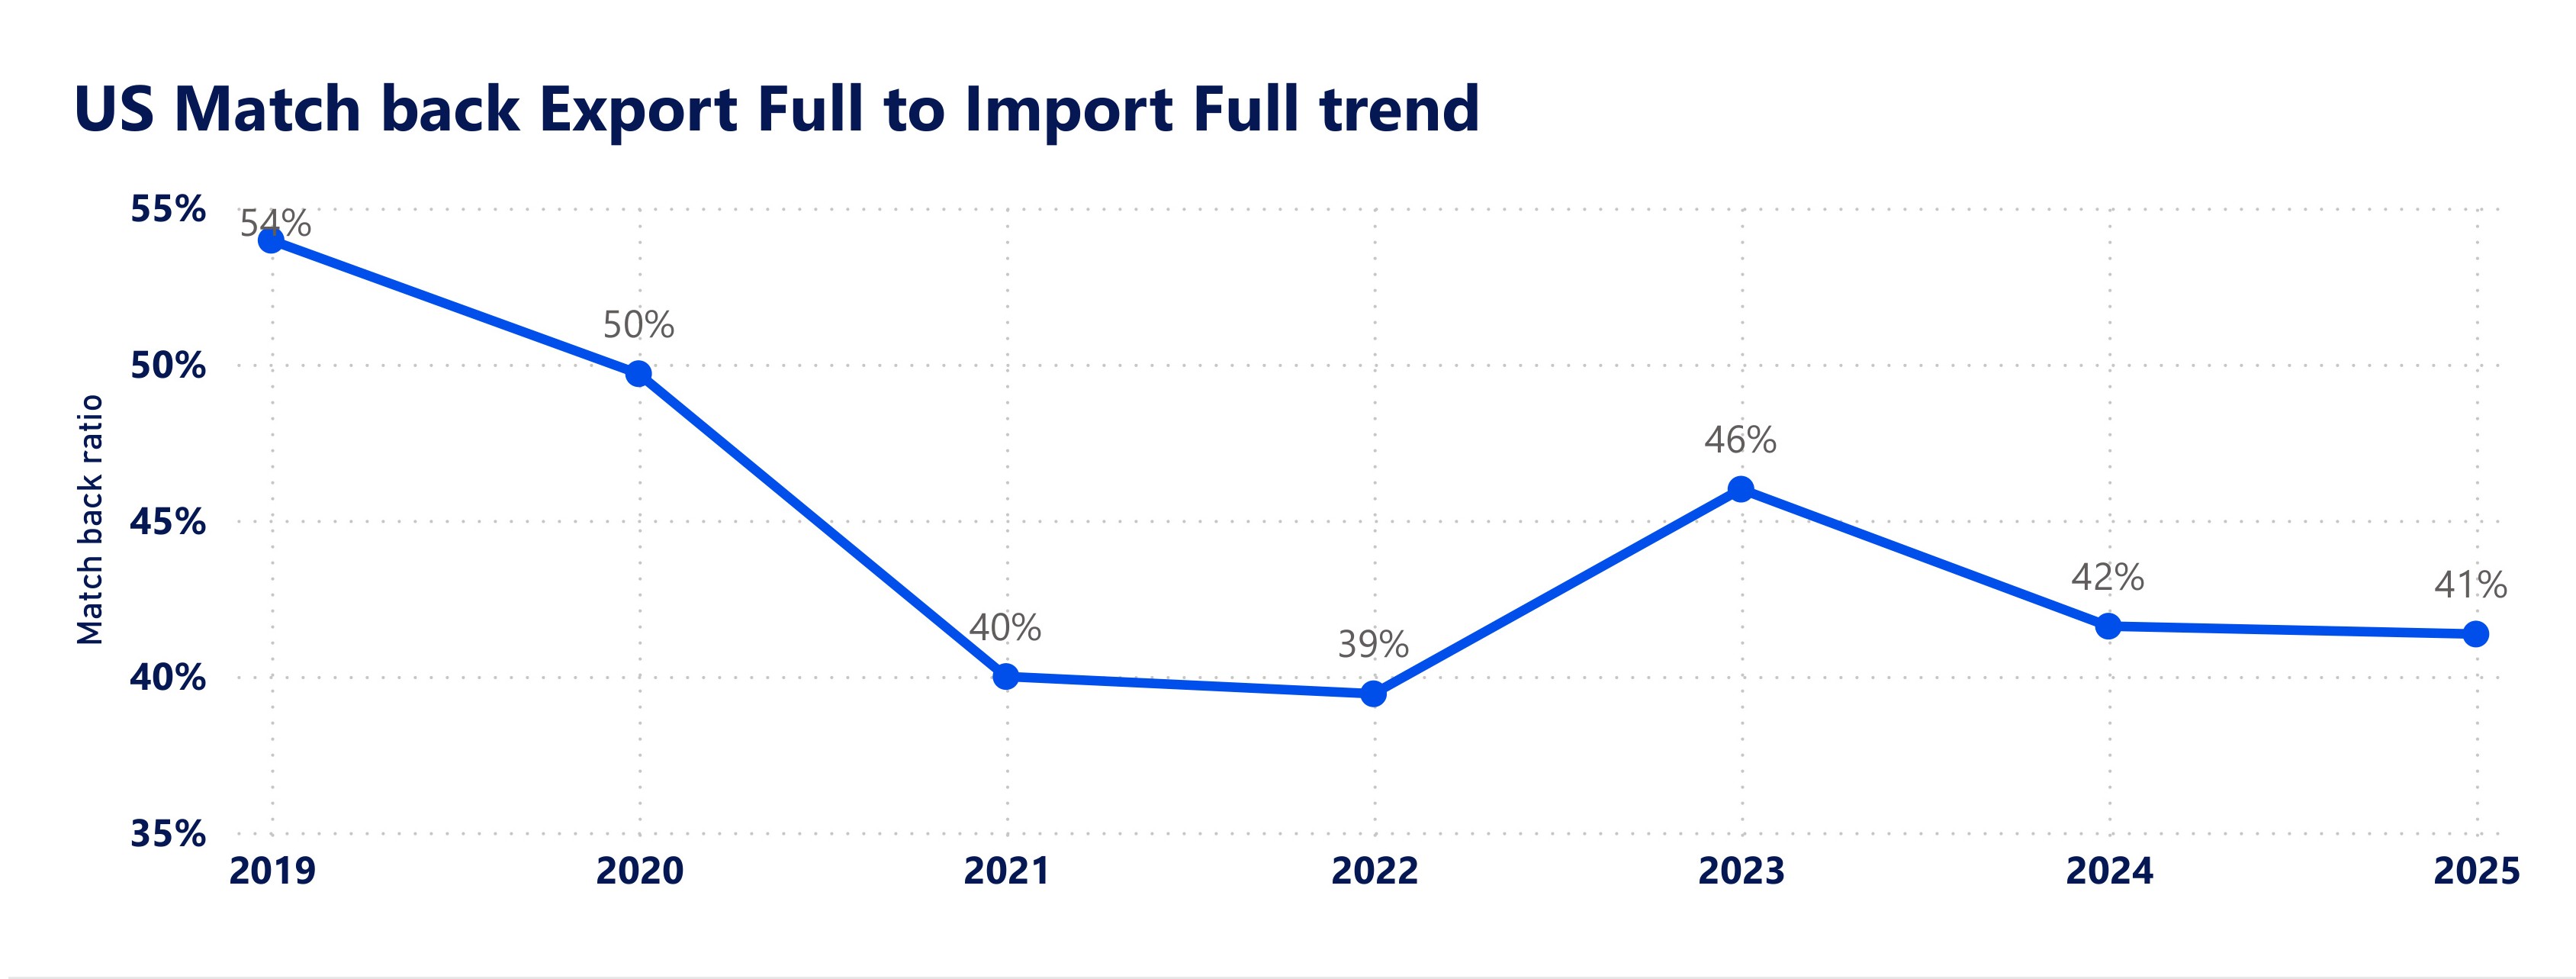
Analysis of full and empty import and export volumes from the U.S. Department of Transportation (2019 to 2024) and the Federal Maritime Commission (FMC, Q1 2024) reveals a measurable decline in efficiency. The average Match-Back Ratio, the proportion of full exports to full imports, has fallen from 54% in 2019 to 41.6% in 2024. This means carriers are repositioning a larger share of containers empty.
Although there are limitations in the data (it is presented in TEU rather than by container size/type, and the carrier data is currently limited to Q1 2024), when combined, these datasets provide valuable insight into the range of carrier performance. This analysis excludes the impact of the “better as empty” strategy carriers sometimes use in periods of high spot market rates.
The spread of performance across carriers underscores that while structural imbalance cannot be removed, operational execution varies widely.
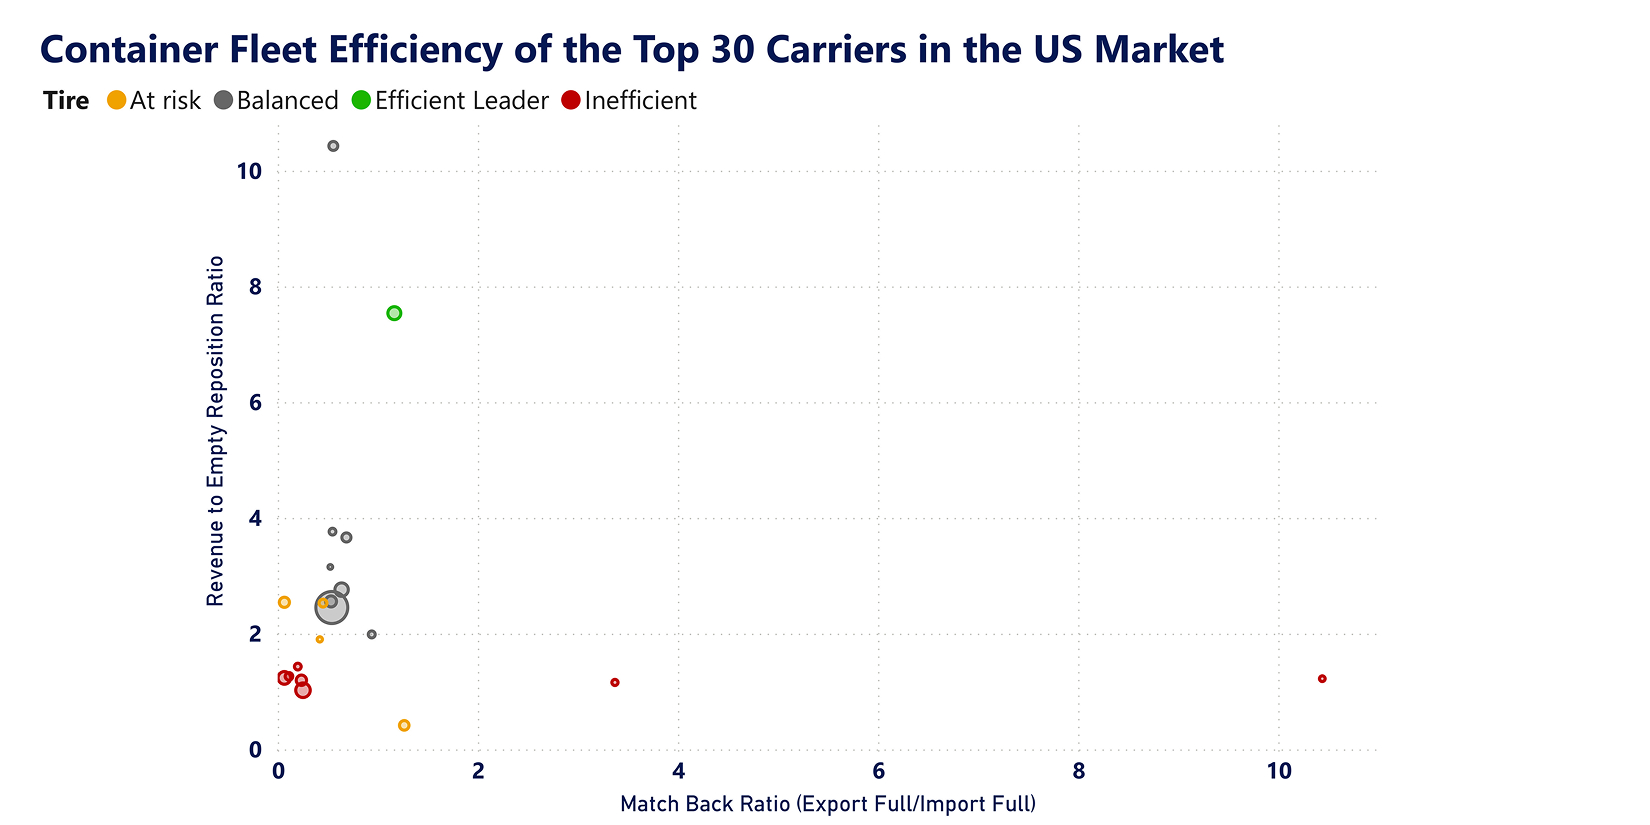
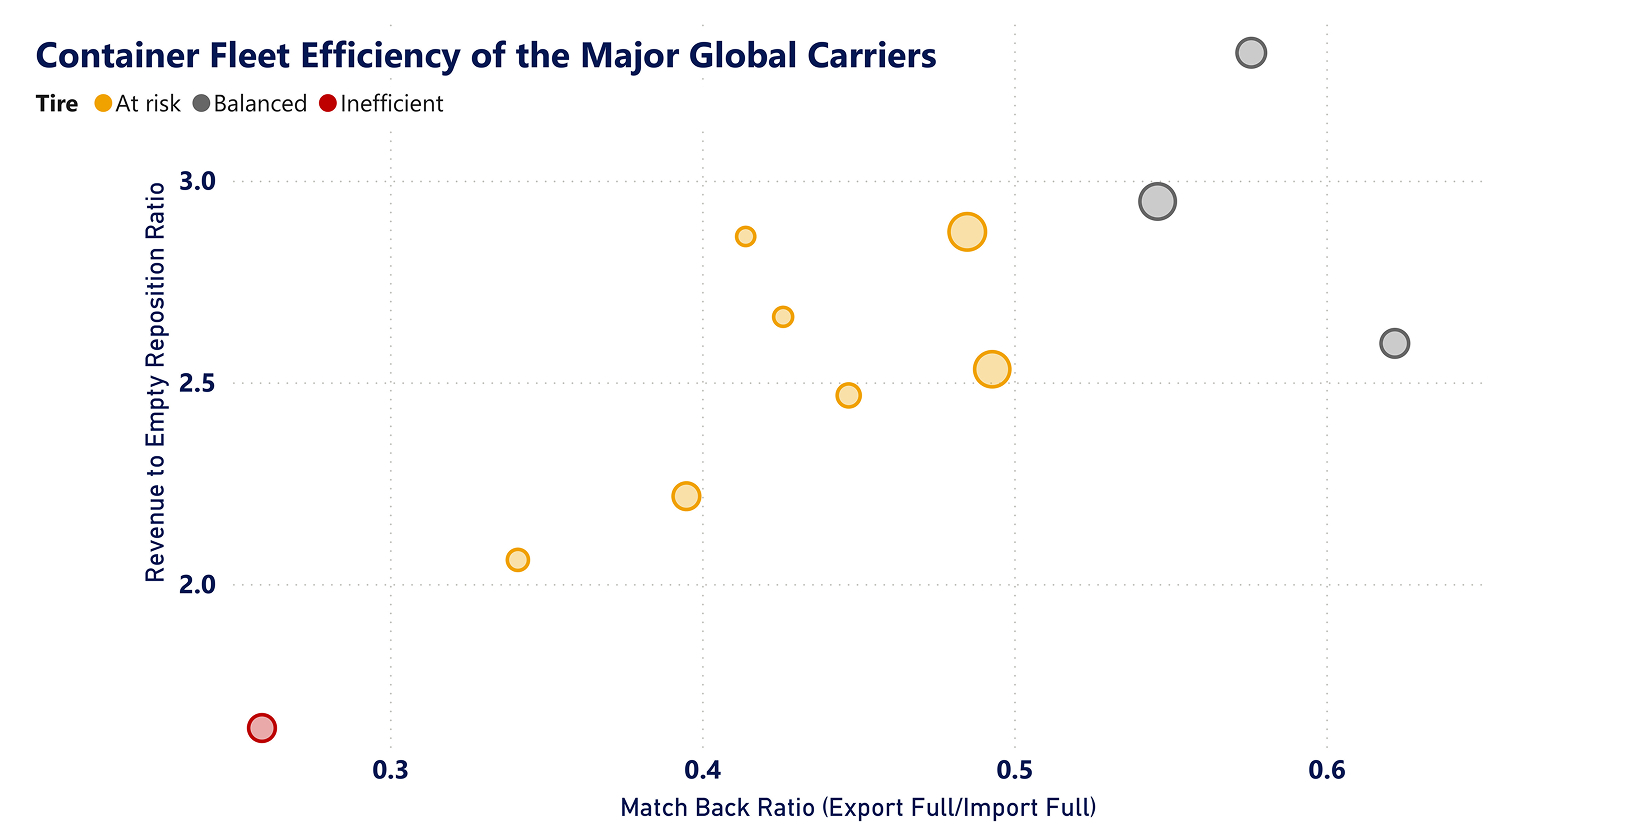
The data highlights significant variation in how carriers manage container flows.
Carriers with strong match-back performance also achieve higher proportions of revenue-generating shipments, reflecting better utilization of equipment and stronger trade-lane balance.
In contrast, carriers with elevated empty repositioning rates show weaker match-back and revenue ratios, exposing higher operating costs and lower asset productivity.
The role of data and technology
While empty repositioning cannot be eliminated, it can be minimized through smarter data use and collaborative market mechanisms. WiseTech Global sees significant opportunity: to connect data sources that have traditionally operated in silos:
- U.S. Port and FMC data provides a foundation for framing the problem and benchmarking carrier efficiency.
- WTG’s demand forecasting model could deliver port-level forecasts of container demand by size and type, helping align equipment flows with expected trade needs.
- Carrier IoT data offers real-time visibility into container availability.
- Marketplace platforms can bring carriers, freight forwarders, and BCOs into a shared ecosystem, communicating and matching equipment and demand more effectively.
Together, these capabilities can help shift the industry toward proactive optimization.
- For carriers, this means reduced repositioning costs, improved profitability, and stronger asset utilization.
- For freight forwarders and BCOs, it creates greater certainty of service levels, improved equipment availability, and more predictable booking outcomes.
The path forward
Empty repositioning cannot be eliminated, but it can be strategically managed. By embedding predictive analytics, operational IoT insights, and shared digital ecosystems into core processes, carriers and their partners can transform a structural cost into a controllable variable. This shift offers not only cost savings, but also an industry-wide opportunity to redefine efficiency and resilience in global logistics.
Further information:
- Download the CargoWise Market Intelligence & Analytics flyer